There are hundreds of signals and
clues being revealed to us constantly through price action on the charts. Some Forex signals are single candles, some are multiple candle combos, but all are recording price action through their reactions to various conditions. Everything that price does means
something – even when it does nothing.
How we interpret these clues is what gives us the edge in our trading
decisions. Today, I am going to discuss the
most common single-candle reversal signals, that when used in the right context will help to guide your
trades and provide you with low-risk/high-reward opportunities.
Reversal Signals have many names, but don’t let that confuse or intimidate you
- they're actually pretty simple to identify and interpret. First we are going to look at what is commonly known as the pin bar. These single-candle
signals have a long tail or "wick" (on one side only) with a short body and little to no wick on
the other side; this body type means that price attempted to move in a particular direction and reversed. These candles point out a change in momentum and often occur at turning points. By pairing these
signals with other factors present in the chart, you can increase the
likelihood that you are identifying low-risk, high-reward opportunities in your
trade decisions. Now let’s look at the
specific types, below:
.png)


The Shooting Star
This candle sits atop a hill. Notice how the opening price and the closing
price are very close to each other, but the candle has a long wick at the
top. This is a bearish rejection candle,
because price tried to go up and was driven back down (indicating strong bearish
pressure). Also, notice how there is a
gap in between the bottom of the rejection candle and the underlying EMAs. When price is extended too far from the EMAs,
there is pressure on it to pull back towards the mean. This easily identifiable reversal candle was
a good signal and in the proper context.
Price plummeted the next day, retested a few days later, and then dropped like a rock all the way
to the support level below.
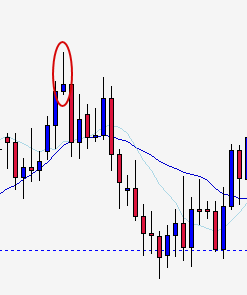
The Inverted Hammer
The Inverted hammer looks just like the shooting star except that it occurs in a trough or valley during a trend. These rejection candles are
actually signs of a (bullish) potential reversal. So, even though the price move up was driven back down - the fact that it attempted to move up aggressively in the first place is what signals weakness in the trough and that price may soon climb sharply. This makes sense since they are showing signs
of weakness to moving down. Think of it this way: in the chart segment above, we have an uptrend; the circled inverted hammer happens during the trough or valley of price action when price is just consolidating and moving side-to-side, when we see that pin bar we know that the buyers are trying to drive price up (which is in align with the trend direction anyway).
The Hammer
Picture this candle hanging from the bottom of a trough (they say in the biz that it is "hammering out a bottom"). It also looks like a hammer, with it's long wick falling below the surrounding candlesticks.
It is the opposite of the shooting star and acts in the same way except
that it indicates strong bullish pressure.
In this example, we see that price has broken below a support level, but
the hammer candle tells us that there is strong buying pressure and that price
will not continue downward (at least in the immediate future). Experienced traders know that when they see
this signal, price is likely to come up and test the resistance level (which previously provided support) – and
it will either hold as resistance (price remains below this level) OR it will
break through the resistance and the level will again act as support (as it did
in this case). However, we must be
careful when attempting to trade near or through strong support/resistance levels, because where
there was previously strong support – we may now find strong resistance. Even though this appears to be a failed break
of the support level – traders should look for continued signals before
deciding what price is most likely to do next.
If price were to rise up to the resistance level and print a strong
bearish rejection candle (picture a shooting star piercing the resistance
level) THEN that would indicate that the bears are still in control. Instead, in this example we see a couple
small indecision candles just above the s/r line. This is not convincing enough in my opinion
and the trader should sit back and wait for further price action signals before
making any decisions. This is what is
meant by proper “context”, and this signal lacks it I believe.
The Hanging Man
Hanging Man: The hanging
man is the opposite of the inverted hammer signal; but operates in the same
manner. In this example, we have two
small hanging man candlesticks that touch the level of resistance above, but do
not “break-through” it. Notice that the
wicks of these candles are respecting the 10-day EMA just below them. Then, we have a larger hanging man whose wick
pierces the 10-day EMA deeply. Remember,
these long wicks are showing us that there is repeated bearish pressure (though
it failed initially). Even though price rose back up to test this resistance
level again after the hanging man candles, its continued failure to break
through this level is further indication that the bears are still in control –
and indeed we see a sharp sell-off directly following which drives price all
the way down to the next significant support level below. Even
before we are given the hanging man signals, we see a failed attempt to break
through the level by a powerful bull candle – again further evidence that the
bears are in control and the level will not be breached.
In the examples above, I have pictured traditional "pinbar type" candlesticks that are showing a price reversing; however, the concept is somewhat flexible. Many times, you will see candles with larger bodies (aboout 50%) that are reversal signals as well candles as well. The position of the candle and size of the price rejection are far more important than the "perfect pin bar body". In the chart below we see some other examples of what a rejection candle might look like:
No comments:
Post a Comment