Saturday, November 8, 2014

WHY DOES PRICE ZIG-ZAG IN A TREND?


There's a common saying in trading circles, that "the trend is your friend".  This is true, it is safest to trade in the direction of the predominant trend (if one exists).  Even though 'the trend is your friend', traders will learn that riding a trend takes patience and a lot of bravery to make it through retracements profitably.  But why does price retrace, consolidate and stall?  It would be nice if you were able to enter a trend at the bottom and price steadily climbed to the "top".  But it doesn't, price stair-steps, it goes in waves, it shoots up and then back down again, or maybe moves sideways for extended periods of time.

Because people are trying to ride a trend (or take advantage of volatility), when they see price moving they tend to jump on board which gives the trend continued momentum (whether it is bullish or bearish momentum, in forex it doesn't matter, as long as price is moving we can make money on it) - that is why it is safest to trade in the direction of the trend.  Sometimes, however, price takes a break (consolidates in the side-to-side pattern, flag patterns, etc.), or sometimes it retraces.  Retracements happen when selling pressure temporarily exceed buying pressure in a bullish trend, or vice versa. Especially at important support/resistance levels, you will see price falter and possibly reverse, because people are always trying to pick a "top" or "bottom" of a trend. However, if the momentum of the trend is too strong, price will overcome the retracement and continue along it's original path.

Let's look at some examples:


In the EURUSD Weekly chart above, we see a bullish trend from about June 2013 Until around May 2014, which then transitions to a bearish trend.

Most people don't trade off of the weekly chart, I am just using it here to see the big picture more clearly.  Let's pretend though that we were fortunate enough to buy at around point 1.  This would place us right at the bottom of this bullish trend (the best entry possible).   A long-term trader might stay in that trade all the way to the top.  Heck, in a perfect world you would cash out at the double top and then place your sell order and ride it back down (the ride down is usually more exhilarating with less scary backtracking!)

But keeping it in perspective here, it's not as if you knew at point 1 that a large trend was about to play out.  At point one, there is no clear direction established.  Imagine how brave you would have to be at point 2 to stay in the trade, when you have lost 50% of your gains since point 1.  Keep in mind as well that this is the weekly chart, so this pain is extended over a three week period of seeing you profits decrease. Could you stand that?  Most traders can't, and that is why I believe that scalping and swing trading are far more popular, rather than staying in one trade for the entire time. I find that most forex traders are 'in and out' of trades within the day, or a few days at most.  So, most people are not entering at the bottom and holding a trade all the way to the top on a weekly chart, but these same patterns are present on the lower time frames as well, and the same mental discipline is required to handle these retracement situations properly.

It helps if you understand the typical movement of price and price patterns (from level to level) and the way retracements work.   If you did not enter this uptrend at point one, you would want to shoot for the retracements (dips or valleys) labeled 2, 3, or 4 for your next entry (that way you are getting the best entry price).  Or, alternatively, if you were trying to catch the down trend, you would try to put in your sell order at a peak (where buyers temporarily take control), which would get you the best selling price. This was harder to do in this example due to the strength of the bearish move.  Another thing to consider is that if you are a long-term trader or you are just staying in a trade to try to catch as much of a trend as possible - you could add to your position at these points, and move your stop loss up as you go (remove risk from first trade, add second trade).  In this way, you could stack your profits quickly.

The last thing I would like to point out is the end of the chart.  I have drawn a large retracement here, just to illustrate that after a large sharp drop in price, a large retracement is likely to occur if that support level holds.


A few examples of patterns mentioned above  

The flag pattern consolidation, usually a continuation pattern, these tend to bring swift movements at the break of the pattern:


Side-to-side consolidation in a bullish trend:


and a pennant flag pattern:


Friday, November 7, 2014

SUPPORT AND RESISTANCE BASICS FOR THE PRICE ACTION TRADER


Like most people, when I first began learning the price action trading method, I was pretty focused on "signals" - or identifying certain candlestick patterns or combos that could lead to predictable results.  This is an important skill, don't get me wrong; it is this ability that leads a trader to identify possible "opportunities".  However, I found that sometimes my trades went well, and sometimes they did not (all based on essentially the same types of signals).  So, what is it that made some trades fare better than others?  The invisible levels of support and resistance in the charts were affecting my trades in unforeseen ways, and once I truly began to understand support and resistance - my trading success rate skyrocketed.  

A previous post, "Stop-losses, Entries and Exits" touches on the topic of making sure that you're using support and resistance levels (from here on referred to as "s/r levels") when deciding when to get in, where to put your stop loss, and how much room your trade has to run before it's likely to stall (in other words, where you should get out, or at least anticipate having to cope with waiting or even accepting price retracement before it begins to move in the desired direction again).  In case you don't really understand s/r levels that well, I am going to go into this topic in detail here.  

There are really two aspects of understanding how to use s/r levels effectively. The first part is that you have to correctly place these levels on your charts, or they are useless or even harmful to your trading decisions.  The second aspect of it is understanding how these 'correctly identified levels' should impact your choices of whether or not to get in a trade (even if the signal is good), where to place stop loss and exits, etc.  Basically, by placing the s/r lines on your chart, you should be able to somewhat predict the path that price will likely take (remember, we can never be 100% sure - so don't bet the farm).  

Let's look at a pair, it doesn't matter which one - but we'll use USDCHF for this example (a popular pair), and I will describe why I decide to place the s/r lines where I do:


Okay, so I start off with a monthly view.  What I am looking for are the turning points, and/or highest highs or lowest lows of the price action.  I am not going to mark every minor level, but only the ones that are easily identifiable at this point.  Also, I am more concerned with where price "closed" than where it went temporarily (indicated by the wicks of the candles).  Notice how these levels are somewhat evenly spaced apart, you will see this occur naturally again and again with all pairs.  These major levels are the most important.

Now, let's zoom in a little:


Alright, now this is the weekly view of the same pair (all the way to the right of the chart, where price is currently sitting at right now).    Notice how we only see two of the blue lines from the monthly chart where I initially marked s/r levels (so our chart is not overly cluttered).  I drew this red line in just to point out that there is some obvious support going on here - though I am not going to mark it with a blue line because it isn't one of my major s/r levels (I am just making a mental note to myself). Right now, price is butted up against this overhead resistance (top blue line), and if previous history is any indicator, it will probably not break through.  It has been ranging a bit between this support marked in red and the overhead resistance.   It will most likely reverse and continue in the downtrend that it is already in, so I will be looking for a bearish rejection signal (see my previous post on signals) and I would be looking for price to continue down at least until the level of the red line, and if it breaks past that - I would expect it to drop down to the next support level.  That's how price action works, trends tend to continue in the direction they are going in (until they don't! but you're still safest to trade with the trend).  And price tends to flow from one s/r level to the next.  It is when they approach these levels that you need to be careful with entering trades, because they can stop suddenly, stall and consolidate for quite a while, or reverse entirely. These levels are like a predictable area where you can expect some kind of interference with the price movement.

Now, let's zoom in further and look at the daily chart:


This is a close up of a section of the daily chart taken from around July/August 2012.  I am displaying this section to demonstrate a point.  If you are unsure of whether you are doing it right, when placing your s/r lines, you are looking for resistance and/or support (marked with the red lines) and you should see (usually, but not always) strong power candles that push through the levels (such as those circled in red).  If you can identify these two things happening at the levels you have marked, you are probably doing it right.  S/R identification is somewhat of an acquired skill, so with practice you'll easily be able to identify these areas quickly.  Now, let's go back to present day price action on the daily chart:


Here, we can see that price has tested this resistance level three times during this move.  The first two attempts stopped right at our s/r level, and the last one (yesterday and today's candles) broke through with a power candle, and then back down below the level.  We call this a failed break, and some people consider this a rejection signal in itself.  Personally, I am still not convinced enough to put in a short trade.  Now, if I were to see price come up from below to test the resistance level again on the daily or 4-hour chart and drop a nice strong bearish rejection candle, I would consider a short trade.  It would look like this:


Tuesday, November 4, 2014

PRICE ACTION REVERSAL SIGNALS

There are hundreds of signals and clues being revealed to us constantly through price action on the charts.  Some Forex signals are single candles, some are multiple candle combos, but all are recording price action through their reactions to various conditions.  Everything that price does means something – even when it does nothing.  How we interpret these clues is what gives us the edge in our trading decisions.  Today, I am going to discuss the most common single-candle reversal signals, that when used in the right context will help to guide your trades and provide you with low-risk/high-reward opportunities. 

Reversal Signals have many names, but don’t let that confuse or intimidate you - they're actually pretty simple to identify and interpret.  First we are going to look at what is commonly known as the pin bar.  These single-candle signals have a long tail or "wick" (on one side only) with a short body and little to no wick on the other side; this body type means that price attempted to move in a particular direction and reversed.  These candles point out a change in momentum and often occur at turning points.  By pairing these signals with other factors present in the chart, you can increase the likelihood that you are identifying low-risk, high-reward opportunities in your trade decisions.  Now let’s look at the specific types, below:

The Shooting Star


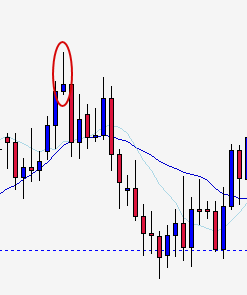
This candle sits atop a hill.  Notice how the opening price and the closing price are very close to each other, but the candle has a long wick at the top.  This is a bearish rejection candle, because price tried to go up and was driven back down (indicating strong bearish pressure).  Also, notice how there is a gap in between the bottom of the rejection candle and the underlying EMAs.  When price is extended too far from the EMAs, there is pressure on it to pull back towards the mean.  This easily identifiable reversal candle was a good signal and in the proper context.  Price plummeted the next day, retested a few days later, and then dropped like a rock all the way to the support level below.


The Inverted Hammer


The Inverted hammer looks just like the shooting star except that it occurs in a trough or valley during a trend.  These rejection candles are actually signs of a (bullish) potential reversal.  So, even though the price move up was driven back down - the fact that it attempted to move up aggressively in the first place is what signals weakness in the trough and that price may soon climb sharply.  This makes sense since they are showing signs of weakness to moving down.  Think of it this way:  in the chart segment above, we have an uptrend; the circled inverted hammer happens during the trough or valley of price action when price is just consolidating and moving side-to-side, when we see that pin bar we know that the buyers are trying to drive price up (which is in align with the trend direction anyway).  

The Hammer


Picture this candle hanging from the bottom of a trough (they say in the biz that it is "hammering out a bottom").   It also looks like a hammer, with it's long wick falling below the surrounding candlesticks.  It is the opposite of the shooting star and acts in the same way except that it indicates strong bullish pressure.  In this example, we see that price has broken below a support level, but the hammer candle tells us that there is strong buying pressure and that price will not continue downward (at least in the immediate future).  Experienced traders know that when they see this signal, price is likely to come up and test the resistance level (which previously provided support) – and it will either hold as resistance (price remains below this level) OR it will break through the resistance and the level will again act as support (as it did in this case).   However, we must be careful when attempting to trade near or through strong support/resistance levels, because where there was previously strong support – we may now find strong resistance.  Even though this appears to be a failed break of the support level – traders should look for continued signals before deciding what price is most likely to do next.  If price were to rise up to the resistance level and print a strong bearish rejection candle (picture a shooting star piercing the resistance level) THEN that would indicate that the bears are still in control.  Instead, in this example we see a couple small indecision candles just above the s/r line.  This is not convincing enough in my opinion and the trader should sit back and wait for further price action signals before making any decisions.  This is what is meant by proper “context”, and this signal lacks it I believe.

The Hanging Man


Hanging Man: The hanging man is the opposite of the inverted hammer signal; but operates in the same manner.  In this example, we have two small hanging man candlesticks that touch the level of resistance above, but do not “break-through” it.  Notice that the wicks of these candles are respecting the 10-day EMA just below them.  Then, we have a larger hanging man whose wick pierces the 10-day EMA deeply.  Remember, these long wicks are showing us that there is repeated bearish pressure (though it failed initially). Even though price rose back up to test this resistance level again after the hanging man candles, its continued failure to break through this level is further indication that the bears are still in control – and indeed we see a sharp sell-off directly following which drives price all the way down to the next significant support level below.   Even before we are given the hanging man signals, we see a failed attempt to break through the level by a powerful bull candle – again further evidence that the bears are in control and the level will not be breached.

In the examples above, I have pictured traditional "pinbar type" candlesticks that are showing a price reversing; however, the concept is somewhat flexible.  Many times, you will see candles with larger bodies (aboout 50%) that are reversal signals as well candles as well.  The position of the candle and size of the price rejection are far more important than the "perfect pin bar body".  In the chart below we see some other examples of what a rejection candle might look like:


(This chart was borrowed with permission from TheForexGuy.)


Monday, November 3, 2014

STOP-LOSSES, ENTRIES, AND EXITS

A REVIEW OF STOP-LOSSES, ENTRIES, AND EXITS
FOR THE PRICE ACTION TRADER

First of all, every trader should be using a stop loss.  When placed properly, they are there to protect you in cases when the market has unpredictable volatility or when price moves against you (despite having given you all the “right” signs).  Some traders believe that the big movers and shakers of the market are “stop-hunting” and purposely pushing the market one way or another to take out the retail traders stop-loss positions; I don’t believe that to be the case at all.  If you are finding that your stop-losses are regularly getting hit, the most likely problem is that you aren’t placing them in the correct location and/or you aren’t entering the market at the right place. 


Let’s look at an example of a current bearish trending market, gold.  The chart that I primarily trade off of is the New York close daily chart, so that is what we are focusing on here.  I use the weekly chart to guide my support and resistance placement, and use 10 and 20 day EMAs for dynamic support and resistance. We are going to be looking for two of the most common price action signals, the rejection candle and the inside day combo.  


TRADE ONE printed a bearish rejection candle (with a bullish close).  If you could see the chart to the left, you would see a nice bearish trend in progress; therefore, this rejection candle off of the 10-day EMA is a continuation signal (meaning that the market is likely to continue in a bearish direction).  If you decided to take this signal and place a short order, the stop loss should be place a little above the high of that rejection candle.  This particular candle is somewhat large, which makes our risk a little higher.  It is always ideal if we can enter the short trade at a 50% retracement for better entry position and smaller risk carried.  Luckily, the next day’s candle seems to have just hit the 50% retracement mark before dropping in price (and if it didn’t, the third day after the rejection candle definitely did – however, at this point the market is moving sideways and the trader may have decided not to open the trade).   Trade one, if taken, would have reached over 3X risk payout. 

That brings us to TRADE TWO.  Personally, I would not have taken this trade because although the market was very gradually stepping down, the price action seemed too sideways and unpredictable to me.  You shouldn’t trade in sideways markets.  Also, because we are in mid-range between these two support levels, I am not likely to be able to get my desired 3X risk/reward ratio unless price were to break through the support level (as we can see, price stopped at the lower support level and gave a little over 1X risk, not enough to tempt me).  What we have here is an inside day combo.  Normally, in a trend, inside day candles printed on the daily chart can be the precursor to very strong moves (and indeed there was a strong move two days later).  If a trader were to have taken this trade, they should have set their stop loss just above the high of the inside day candle (or if they were really conservative, above the high of the mother candle) – and their entry at the break of the low of the inside day candle.  In this case the break out did not occur the day following the inside day candle, but on the following one. 

Now that price has reached the bottom of this support level, we see a strong rejection in the form of a bullish power candle.  I am not going to trade the retrace, so for this example, I am only looking for sell signals.  At this point, we should be waiting for price to retrace up and test the resistance level above. Sometimes price will not go all the way up to test the resistance but will come up a little and then plummet down again to test support or break through it.  But in this case we see a straight bullish climb up to the opportunity of TRADE THREE.  This one is tricky.  It looks like a good bearish rejection signal, but see the candle just prior to trade three’s candle?  It has broken upward through both the ten-day and twenty-day EMAs.  All of the candles pictured before it were respecting the 10-day EMA and it was acting as dynamic resistance.  Now that this candle has broken through these EMAs, we see that the candle for trade three is sitting on-top of the EMAs and they are now acting as support.  So, despite that fact that we are seeing a bearish signal, we should be wary because price may ride that upward pressure to the next level of resistance – and that is just what happened.  If we had entered trade opportunity #3, our stop loss would have been taken out. 

TRADE FOUR is another inside day combo, with a high that almost touches our level of resistance before dropping back down.  This signal is not valid in my opinion though, because the mother candle is so large, that it isn’t surprising that the next candle falls inside of it.  Usually, an inside day candle combo (that falls within a trend) means that price is consolidating and about to break out; in this situation however, we just have a volatile mother candle followed by a couple indecision candles.  Again, I wouldn’t have considered this a valid setup.  The only thing that this candle told me is that the level of resistance above is holding so far. 

The next trade opportunity, TRADE FIVE, was a nice little rejection candle or pin bar.  It pierced the s/r level and then price was pushed back down just as we would like to see it.  Unfortunately, the next day’s candle did not retrace to the 50% mark, so the trader would have had to make a decision of whether to enter the trade at a lower price (more aggressive move and a bigger risk); none-the-less, if he had done so – in this instance, it would have paid off. 

If a trader missed that boat, another opportunity presented itself in TRADE SIX.  I actually did take this trade, and with entry at the 50% retracement point my profit exceeded 10X risk/reward when I finally exited the trade.  Initially my take profit target was the bottom s/r level, however when I saw how strong the moves were leading up to the approach of my target, I decided to move my target down and trail my stop-loss conservatively behind the price movement.  This enabled me to remove my risk and lock in some profits, while trying to maximize my return on the bearish move.    


WRAPPING UP

In this illustration of the gold bearish trend selling opportunities, we see that trade’s one, five, and six were our best opportunities.  That is what trading is really all about, being able to minimize our risks and maximize the potential of our trade decisions.  The placement of stop-losses, entry positions, and exit positions are all dependent on what type of signal you are taking, the size of the signal, and where the signal is located relative to the support and resistance levels (horizontal or dynamic) of the chart. 

The two signals that we identified today are most reliable in the conditions shown above on the daily chart.  The lower time frame charts may give the same signals, but they are not as safe to trade.  Remember, it is always safest to trade with the trend, especially for the beginner trader.  But to trade with the trend, you have to be able to identify one!  If you can’t tell what a chart is doing, either because the price action isn’t clear to you, or just due to your inexperience, you shouldn’t be taking a trade.  

WHAT IS FOREX TRADING?


Forex is the foreign exchange market (also known as the currency exchange market or just FX). If you have ever visited a foreign country and needed to trade some of your currency for their currency – you have already participated in a Forex transaction.  Traders do not actually “handle” the foreign currencies that they buy/sell, but are speculating on the currency exchange rates between two countries.  Since exchange rates change constantly, there is always an opportunity to profit from these exchanges.  Forex markets trade about $5 trillion (USD) per day, making Forex the largest and most liquid financial market in the world.  By comparison, all the world’s stock exchange markets combined turn over around $50 billion USD per day; in other words, the Forex market trades about 98 times more volume than the stock exchanges daily!

When and where do you trade Forex?

This international market has no (physical) central marketplace for foreign exchange.  Trades are made almost instantaneously online from just the push of a button.  You can basically trade from anywhere.  On vacation in Hawaii?  No problem!  As long as you have an internet connection, you can trade from your laptop, tablet, or even smart phone.

 The trading day has three main sessions: Asia, London, and New York.  These run in a continuous loop, with some overlap – because of the different time zones around the world, there are always markets available to trade via the internet 24 hours a day, Monday through Friday.  So, you really can set your own schedule (though there are certain times that most traders feel are most important to pay attention to, such as NY close). 

Who can Trade Forex?

Although the major players are large financial institutions and corporations, since the advent of the internet – literally anyone can learn to trade Forex and participate in the electronic OTC (over-the-counter) market via a Forex broker.  It doesn’t matter where you’re from, what language you speak, whether you hold any degrees, have internship experience, or special training – no one is checking on your credentials in this field.  The only thing that matters is results.   Since it’s your money you’re risking, you answer to yourself.  Individuals, who trade for themselves and not for an employer, are called “retail traders”.  Retail traders make up about 5% of the entire Forex market.

Four Markets to Trade Forex

The largest market by far is the “spot market”, and when people refer to Forex trading, they are usually referring to the spot market.  The spot market is where currencies are bought and sold for the current price (“on the spot”).  This market has the greatest liquidity (meaning a readily available supply of buyers and sellers), which is important because the greater the liquidity the more easily the market can move (and we need that volatility in order to make money in the market).

The “futures market” (sometimes called “forwards”) is where currencies are not actually traded, but instead they deal in contracts to buy or sell at a specific price on a specific future date.  Futures markets’ contracts can offer protection against risk when trading currencies.  Typically, corporations use these markets to hedge against future exchange rate fluctuations, but there are some speculators that take part in these markets as well.  These markets take place in well-regulated and monitored exchanges, so they are relatively safe – but cannot be traded 24-hours a day.

The “options market” deals with financial instruments called “options” that allow a trader to have the option to buy or sell an asset at a specific price on the expiration date of the option.  Options are traded through a central exchange just like futures, so they cannot be traded 24-hours per day.  One downside to Forex options trading is that it has less liquidity than the futures or spot markets.
The last market is the “Exchange-Traded Funds market” (or ETFs).  ETFs allow traders to diversify with different assets, so they could have a combination of currencies and stocks in one ETF.  ETFs are created by financial institutions, and since they contain stocks, they are subject to commissions and transaction costs.  ETFs are traded through exchanges and are not open for trading 24-hours a day.

Advantages of Forex Trading

We’ve already mentioned the fact that the Forex market is open 24-hours a day, Monday through Friday – this is a huge advantage because there are just far more opportunities to trade than a market which is open only during normal business hours.  We also discussed the high liquidity of the Forex market, which means that there is constant change in the price of currencies.  As we pointed out – we need this movement in price in order to create opportunities for us traders to profit.

Another advantage is that unlike most markets, it’s fairly easy to get started in Forex trading.  You don’t have to go to a special school to learn to be a trader or work for a big bank, and you don’t need much money to get started.  There are even free demo accounts offered by brokers, so you can learn how to use the trading platform and get the hang of things before risking your cash.  The internet is flooded with information and videos on “how to trade Forex”, and there are many online communities that a new trader can participate in to learn the ropes as well.  

Forex brokers offer low transaction costs when compared to other exchange markets (in the form of the bid/ask spread).  There are also no fixed lot sizes in the forex market, so you can determine the amount of risk you are willing to take on your trades.  Also, because brokers offer leverage (a.k.a. gearing), a small deposit can still give the trader the ability to make nice profits and at the same time keep your risk to a minimum (leverage does increase risk however, more on that later).

In my opinion, the best advantage of all is that you can work from home, while on the road, on vacation, wherever!  Successful retail Forex traders work for themselves, and don’t have a boss to answer to, can wear whatever they want, look however they want, etc.  Forex trading doesn’t have to take up all of your time either; you can spend as little as 30 minutes a day analyzing the charts and managing your trades.  For many people, Forex is the dream job, that could provide the dream lifestyle and the time to enjoy it. 

Risks of Forex Trading

Like any form of trading, Forex is not without risk.  Forex trading actually carries more risk due to the trader’s ability to leverage capital; leverage magnifies profits, but it also magnifies losses.  For example, let’s say you had a 50:1 leverage ratio, this means that it is possible to enter into a trade for up to 50 dollars for every dollar in your account.  So, while risking $1000, you could potentially earn $50,000.  However, you also run the risk of losing funds based on a $50,000 trade, so if you aren’t careful, you can quickly wipe out your account causing a margin closeout. Lastly, make sure that you are dealing only with a reputable broker who is in good standing with the recognized regulators for their country.  Fraud used to be a serious problem in Forex trading, but most countries now have regulators that supervise the trading market and brokers; just remember that not all countries’ governments and regulators are free of corruption themselves, so brokers from these areas are riskier.
 
The fact is that majority of traders lose money in the Forex market because they rush in and begin trade before they really understand the markets.  Some traders fail because they approach trading like gambling. The thrill of Forex can be addictive, and certain traders seem to be unable to stop themselves from overtrading and over extending their risk.  Also, be cautious of paying for things like “magical indicators”, “signal services”, and expensive “guaranteed to win” trading systems; there are many scams and worthless “helpers” available on the internet. 

Conclusion

Like any skill, it takes time to learn what works with Forex.  It’s not a get-rich-quick scheme.  Successful trading requires to you to not only “figure it out”, but also to have mental discipline, a strong psychological fortitude, and proper money management with a positive risk/reward system in place.